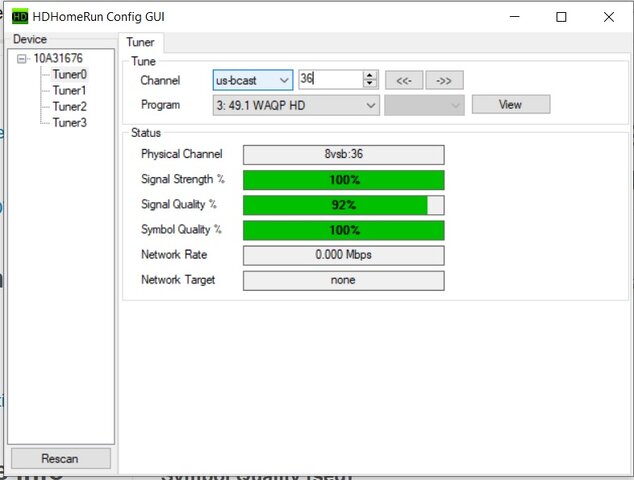
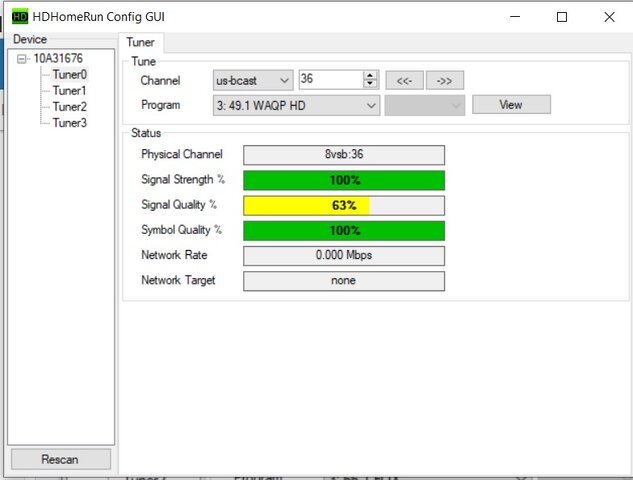
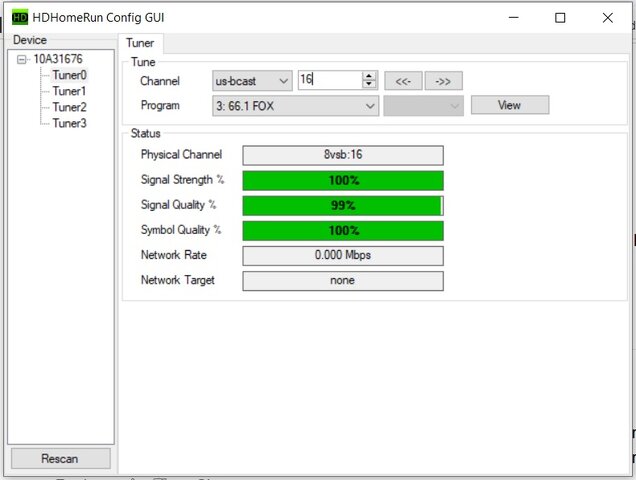
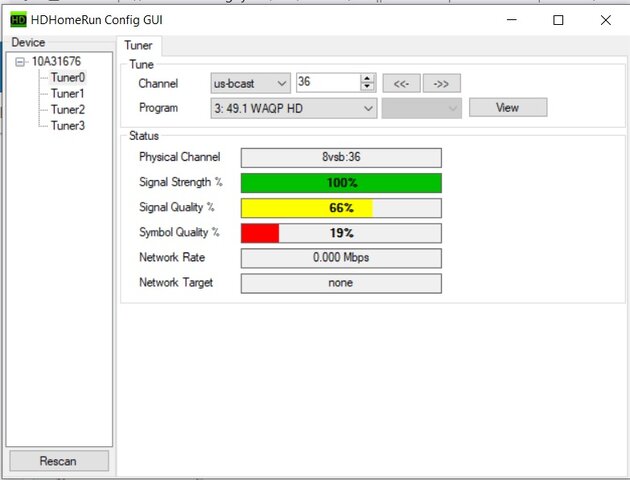
WAQP-49 RF36 Question for Trip

primestar31

SatelliteGuys Master
Original poster
Lifetime Supporter
Mar 15, 2005
13,673
14,339
Beta Omicron Delta III
Trip , I'm 37.5 miles North, and slightly West of this tower. Right on the corner of W Birch Rd, and N Lakeside Dr as seen in the attached printscreen below. Here's my Rabbitears report for the exact location of my antenna, which is a Televes 149884. https://www.rabbitears.info/searchmap.php?request=result&study_id=759888

I seemingly shouldn't have issues at all with this station based on the report, yet it is a semi-frequent pixelating troublemaker for some reason I simply can't figure out. My closest cell tower is 2.37 miles away just slightly East of the antenna bearing for WAQP tower, but the antenna has a 4g/LTE filter that starts at channel rf37.

What is the WHITE area showing on this print, as it's hovering almost right over where my antenna is. Is it some sort of suspected signal hole?


waqptrip.jpg
 
So, to start, the coverage map and the report use two different pieces of software. The map is made with SPLAT! and the report is done with the FCC's TVStudy software. They can and sometimes do disagree, even though both are Longley-Rice. (Different underlying terrain data, different code implementing the model, etc.)

To answer the exact question, yes, the white indicates a spot where SPLAT! is predicting a hole in the coverage. It's interesting that TVStudy doesn't predict the same drop-off that SPLAT! does. It would be interesting to see what the signal looks like on a spectrum analyzer, as I am inclined to trust TVStudy over SPLAT! personally.

I also looked at the cell tower situation and while you're right about the distance, it also looks to be around the same azimuth you'd be aiming your antenna. It also looks to have both T-Mobile and Dish on it, so almost the entire 600 MHz band is in use from that tower. (30 out of the 35 MHz of downlink.) That said, between the distance and the filtering, that's unlikely to be your issue.

What receivers/tools do you have? I can't remember.

- Trip
 
  • Like
Reactions: primestar31
So, to start, the coverage map and the report use two different pieces of software. The map is made with SPLAT! and the report is done with the FCC's TVStudy software. They can and sometimes do disagree, even though both are Longley-Rice. (Different underlying terrain data, different code implementing the model, etc.)

To answer the exact question, yes, the white indicates a spot where SPLAT! is predicting a hole in the coverage. It's interesting that TVStudy doesn't predict the same drop-off that SPLAT! does. It would be interesting to see what the signal looks like on a spectrum analyzer, as I am inclined to trust TVStudy over SPLAT! personally.

I also looked at the cell tower situation and while you're right about the distance, it also looks to be around the same azimuth you'd be aiming your antenna. It also looks to have both T-Mobile and Dish on it, so almost the entire 600 MHz band is in use from that tower. (30 out of the 35 MHz of downlink.) That said, between the distance and the filtering, that's unlikely to be your issue.

What receivers/tools do you have? I can't remember.

- Trip
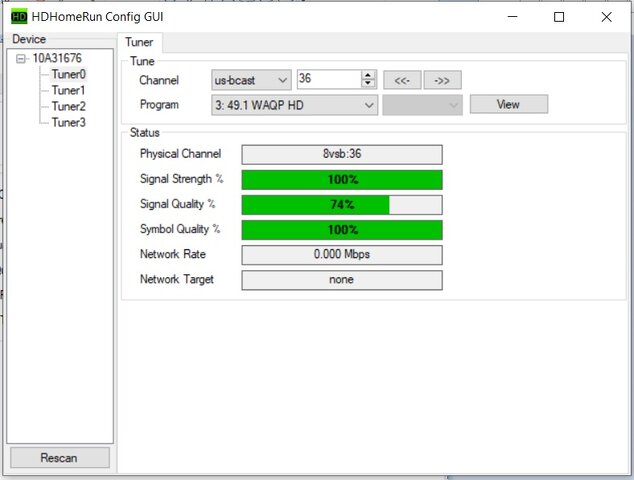
Ok thanks. I have a Tivo Roamio (which IS for sure overly sensitive to multipath), 2- TCL Roku tv sets, and a CHANNELS Dvr running on a RP 4b, and using a HDHR 4k FLEX as its tuner. My antennas are all running through a SmartKom, (which is also powering them) and the SmartKom helps a lot in keeping that station more stable.

I have a TinySA spectrum analyzer, and a Digiair Pro ATSC antenna signal meter that has a spectrum analyzer. I did at one time have the loan of a Televes spectrum analyzer, but had to send that back. It did show heavy cell activity just past rf36 at times.
 
Last edited:

Defy TV being replaced with a revival of Ion Plus

Me Tv Toons

Users Who Are Viewing This Thread (Total: 0, Members: 0, Guests: 0)

Latest posts