Trying to measure Carrier To Noise Ratio

Status
Please reply by conversation.

Pixl

Senior Member
Original poster
Pub Member / Supporter
Feb 27, 2010
1,902
67
Traverse City, Michigan
I've been evaluating several Ku LNB's today and thought I'd make better use of the spectrum analyzer on my Trimax meter. I measured the desired carrier (listed first) then the noise floor adjacent to the carrier (listed second) of four LNB's.

1) -34/-47 Norsat 4000
2) -39/-55 Prime star pop can
3) -34/-50 DMS Spitfire
4) -36/-49 GeoSatPro SL2

What would I want to do with this data for comparison. Subtract the difference or divide one value into the other? What would be a good result?
Or do I have the whole thing wrong?

I am trying to figure out just how you are setting up measurements for this experiment. Betting what your really after is which LNB is out performing the other. Now that's a little difficult, unless this setup is in laboratory conditions so that the input signal to each LNB is exactly the same. I assume you are just swapping out the LNB's at the dish and pointing at the same signal source?

Anyway I think your trying to achieve a quick crude but some what reliable test. In that case you want to look at the difference between power levels of the signal verses the noise. The bigger the difference the better the LNB. However you also want signal gain, so remember a signal level of -34 is greater than that of -39.

In this case the DMS Spitfire wins out hands down. Perhaps the attached pdf is what you are reffereing to?

View attachment Broadcom-Cisco_CNR-SNR-MER.pdf
 
Wally,

Thanks for the reply, true I'm after a quick crude but some what reliable test, after all FTA does not require perfect technology and it is amazing what you can get with junk equipment that is poorly installed. I'm just trying to get a bit above that level. The Trimax 3500 meter has a spectrum analyzer mode in real time. At $599 it is certainly a limited instrument compared to the real thing, never the less, still an indication of what is going on with a scale expressed in DB better than just relying on S and Q from a uncalibrated receiver bar scale. Your PDF does show approximately what I am seeing.
I'm still interested in some help on the math interpreting the data I collected.

The methods maybe crude but still practical. Not sure what math interpretation you require, but know this "for every 3db gain you have a doubling of the power". So for example, the LNB which had a reading of -34 compared to -39; -39 to -36 equals double the power- then go -36 to -33 and you double the power gain again. Hopefully I'm not confusing anyone with this analogy, simply put you have almost 4 times the signal strength when going from -39 to -34 on your readings. But you still have to have quality signal and be able to descern above the noise floor. All the signal gain in the world does no good if you have a ton of noise with it, then your better off with a sensitive front end receiver and a high noise rejection LNB with smaller gain.
 
Ok here are the tests again with the S and Q added.


1) -34/-47 Norsat 4000.......... S-71 Q-78
2) -39/-55 Prime star pop can. S-68 Q-79
3) -34/-50 DMS Spitfire.......... S-69 Q-74
4) -36/-49 GeoSatPro SL2...... S-71 Q-74
 
Ok here are the tests again with the S and Q added.


1) -34/-47 Norsat 4000.......... S-71 Q-78
2) -39/-55 Prime star pop can. S-68 Q-79
3) -34/-50 DMS Spitfire.......... S-69 Q-74
4) -36/-49 GeoSatPro SL2...... S-71 Q-74

OK, I see a problem facing you. The prior tests do not add up to what your receiver is telling you. Now here is an objective question. What is the actuall lnb LO frequency of each lnb? You are measuring these two different ways with different devices. The actual LO frequency of each lnb will vary slightly. If this be true- try this experiment to varify if this is the possible problem; with the DMS Spitfire attached to the dish, manually adjust the LO frequency in your setup menu up/down as much as 2% and see if the S and Q values change. If it does, tweak the frequency for max results, then retest the other LNBs.

Another thing to consider is the accuracy of the spectrum analyser you are using.

Now this experiment is getting interesting, hope you have he patients to follow through with further testing. If you are swapping out LNBs at the dish this can become a time consuming experiment, but possibly rewarding. Actually I thought of doing the very same thing some time ago but haven't had the time. Hell, I'm still waiting to put up my new 6 foot prime focus solid dish and trim the trees around it. But been much to hot and humid lately, not to mention the biting bugs!

After a little more thought, the lo of thye lnb frequency shouldn't affect the S and Q levels, but might blind scan in a channel as a different frequency. But give it a try anyway, what the hell!
 
And to throw in one more variable.....

Measure and graph these measurements on several frequencies from low, mid to high band. While some models will perform well on one part of the frequency range, it may perform poorly at the other end of the range. Measurement on a live feed will provide insight, but not solid data as the carrier and noise thresholds are always changing and the uplinker is monitoring and adjusting (auto or manually) the carriers to maintain the link budget levels. Perform your test between models in a very short time period. The feedhorn match to the reflector size and shape plays a role, so be sure to document the dish model in testing results as this will vary greatly.

Carrier to Noise ratios will not accurately predict the BER (Signal Quality Reading). Frequency stability, internal noise generation, harmonics, slope, heat dissipation and receiver design are some additional factors to consider.
 
Here is the setup.

1.2m Prime star by Channel Master.
Original feed with Prime star "pop can" style lnb.
The Norsat 4000 was also bolted to the OEM feed.
The other lnb's have their own feed.
The Spitfire just fits in the lnb holder and cannot be optimized for focus.
The Geo could be thrust toward the dish and focus was optimized.

Test signal was from 85w my true south sat, Echo star test card that is up most of the time and stable.
Local sky was clear and all measurements done in 1 hour.
 
I have found that the Channel Master dishes always perform better with the matched feedhorn / scalar. All other LNBFs under / over illuminate the reflector and the terrestrial noise increases the signal errors. Your test demonstrates with a good example of how a receiver can produce a higher Signal Quality reading with a LNB with higher noise figures and lower amplification, but with an engineered feedhorn.

You might also cover the feedhorn with foil when measuring the base amplification noise level of an LNB as a live signal from the reflector may be influenced by side lobes from adjacent satellites or terrestrial noise.
 
You might also cover the feedhorn with foil when measuring the base amplification noise level of an LNB as a live signal from the reflector may be influenced by side lobes from adjacent satellites or terrestrial noise.

Never thought of that. Is this a legit engineering procedure?
Wouldn't you miss out on noise comming in from the immediate envorment that would color the measurments to look beter than they are?
 
Never thought of that. Is this a legit engineering procedure?
Wouldn't you miss out on noise comming in from the immediate envorment that would color the measurments to look beter than they are?

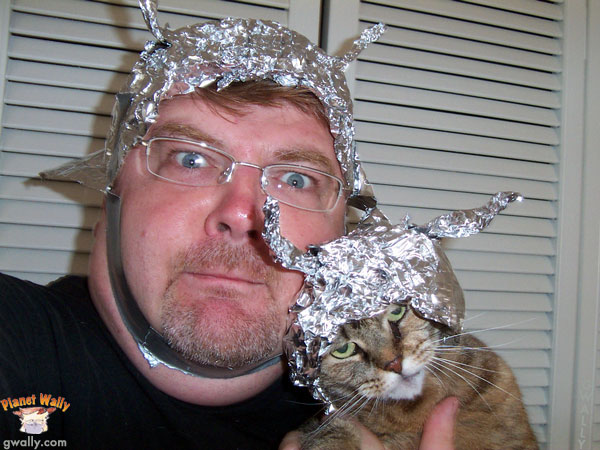
Normally this measurement is performed in a RF neutral chamber without the target and off axis RF source emissions, so the foil hat is not required. ;) :D

No fear in the rf noise coloring any measurement to provide better performance figures. Unwanted RF (noise) will not produce a better CN ratio. The point is to establish a base noise amplification figure void of external RF unintentionally introduced by choice of reflector, scaler or feedhorn.
 
Calculating CNRs can be tricky. If all you have is one signal and some adjacent thermal noise, in principle they can be separately measured and one can translate the results into any of the many methods of expressing the ratios. Differencing the dB measurements is one way, but not necessarily the most meaningful.

In real life one quickly gets into issues because the noise is often colored and signals from adjacent satellites may be mixing in anything from small to significant quantities. I would also be concerned as to the accuracy and repeatability of a spectrum analyzer designed mostly for peaking alignments. I may be old school, but a real spectrum analyzer is a much different animal and the right tool for the job.

Many modern receiver demods can indirectly deduce equivalent CNRs by measuring the statistics of the phase-amplitude points as part of the demodulation process. Some receivers, PC tuner software and even alignment meters provide these numbers, and properly done the results can be more than accurate enough for FTA purposes. The rub is knowing whether the implementations are good or not. I wrote some Linux driver/app code and verified the results on my bench spectrum analyzer. Not everyone has that luxury.

In spite of all of the above, you may be able to make significant relative measurements if you perform enough independent trials and average the results. You can probably get a sense for this by running through the measurements several times. One word of caution though when measuring LNBs: you should have a reference dish/LNB separate from the one you are measuring. Ideally the dishes should be the same and aligned identically. As you change LNBs on one dish, you need to measure the signal and noise powers on both it and the reference dish at as close to the same time as possible. That way you can cancel out the variability in the uplink/downlink power, atmospheric absorption, depolarization, etc.

Covering the LNB with foil doesn't seem like a useful test to me. Part of what you are trying to incorporate in a LNB test is how well it matches the dish in terms of the illumination pattern. Covering a LNB with foil would easily obscure a good LNB or a bad one in this regard. There are other nasty issues, such as the thermal noise of the foil. Just a party trick in my book.
 
Covering the LNB with foil doesn't seem like a useful test to me. Part of what you are trying to incorporate in a LNB test is how well it matches the dish in terms of the illumination pattern. Covering a LNB with foil would easily obscure a good LNB or a bad one in this regard. There are other nasty issues, such as the thermal noise of the foil. Just a party trick in my book.

Agreed on the points of your post. I threw this suggestion out there so the op might easily establish the noise baseline of the LNB in addition to testing with RF. Since we are not working with quality measurement tools, it might be difficult to determine if the LNBF is amplifying or merely generating additional noise from a RF source that is not a constant and defined or a RF neutral environment is not available. Determining the amount of internally generated noise is one more tool that a novice can use in measuring the characteristics of a LNB(f).

I wouldn't suggest that it is a party trick, just another measurement that could provide insight..... If the tin foil hat is not your thing, choose another RF blocking object. :cool:

catintinfoilhat.jpg
 
Pendragon, Brian,

Thanks to both of your intense replies to this. I have a lot to think about and try.
Meantime could you look again at the novice data I collected so far and come to some sort of evaluation given the limitations of my $599 spectrum analyzer.

1) -34/-47 Norsat 4000.......... S-71 Q-78
2) -39/-55 Prime star pop can. S-68 Q-79
3) -34/-50 DMS Spitfire.......... S-69 Q-74
4) -36/-49 GEOSATpro SL2...... S-71 Q-74


EDIT: The cat does not look very happy!
 
Pixl,

There appear to be inconsistencies between your spectrum analyzer and quality results. These could be caused by a wide variety of factors, which makes it difficult to say anything definitive. It is possible for a FTAer with simple tools to distinguish the performance of different LNBs on a particular dish, but that doesn't mean it is easy. You really need a reference dish, you need to carefully realign each LNB/dish as the LNBs are swapped, you need to run several independent trials and you need to select several transponders across the bandwidth because LNBs are notorious for varying CNR responses. At best this process will take hours and require significant data reduction afterwards.

Brian,

Putting tin foil over an LNB will give you a number or numbers related to the self-noise of a LNB, but there will be other components mixed in that will make any comparison difficult. First one would have to measure the noise at several frequency points, because few LNBs exhibit a flat response. Then you will have to figure out what the LNB gain is at each of these frequencies. That will be quite a challenge in itself. Finally you have to factor out the noise contribution of the foil, as its noise temperature will be quite high. This all assumes there is no spurious radiation from the LNB itself, which may be reflected back from the foil. Even if one successfully charts a course through this gauntlet, you will probably find the self-noise of modern LNBs is swamped by background radiation picked up by a dish. While claims of LNB NFs (down to 0.1 dB) are often dubious, they are often inconsequential when compared to the undesired thermal noise from other sources.

It's probably worth pointing out that some of the reason people have problems locking high FEC and 8PSK (or higher order modulations) with low quality LNBs is the phase noise of the LNB, not its self-noise. Many LNB manufacturers conveniently avoid fully specifying phase noise, perhaps because people tend to fall for the self-noise trap. Before anyone gets started, measuring phase noise directly without serious test instrumentation is next to impossible. However the demod technique I alluded to in my previous post will incorporate all the contributions, including phase noise, to the estimated CNR.
 
Status
Please reply by conversation.

Channel Master molded off set dish-odd shape?

Openbox S9 or S10

Users Who Are Viewing This Thread (Total: 0, Members: 0, Guests: 0)

Who Read This Thread (Total Members: 1)